
Trans people live in diverse communities, intersecting ethnicity, age, disability, religion and sexuality. This is not news, but the Office for National Statistics released fresh data comparing the gender identities of people in England and Wales with key demographics which were recorded in Census 2021.
There are some important caveats to consider when viewing Census 2021 and analyses. Many trans and non-binary people were unable to share their true identities in the census because of a fear of outing themselves and associated risks to their safety.
Another caveat is that as soon as the data was gathered, it was immediately historic, so this is not live information, but it is the richest and most accurate data we have today on trans and non-binary people in England and Wales.
There were some local areas which repeatedly came out on top across all demographics. Birmingham had the most trans men (911) and trans women (896) identifying as straight or heterosexual, and it was also most popular for trans men (627) and trans women (554) who are married.
Manchester was most popular for trans women who are ‘lesbian, gay, bisexual, or other’ (245) and also had the highest number of Muslims who said their gender identity was ‘different from sex registered at birth’ (1462).
Brent and Newham (both in London) appeared a significant number of times in the top five places for different types of trans people to live, including for those who are married, Muslim (Newham, 1431), Hindu (Brent, 547), Buddhist (Brent, 53), and Christian (Newham, 1822, and Brent, 1566).
The places with the highest number of people who are religious and whose gender identity was different from their sex registered at birth (self-reported) was Birmingham with 3041 Muslims and 2302 Christians, followed by Newham with 1822 Christians and Leeds with 1686 Christians. Leeds had 1826 trans people who reported having no religion.
Gender and sex were also compared. Across England and Wales, of the trans men, 32,715 were male and 15,732 were female. For trans women, 31,481 were female, while 16,096 were male. There was a third trans identity within the gender versus sex dataset labelled as ‘all other gender identities’. Of those, 30,261 were female with 729 in Brighton and Hove and 704 in Bristol, and 18,080 were male, with 465 in Bristol and 445 in Brighton and Hove.
The ethnicity data reported ethnic groups within the group called as those whose gender identity is different from sex registered at birth. The largest group were ‘White: English, Welsh, Scottish, Northern Irish or British’ (126,895), followed by ‘Asian, Asian British or Asian Welsh’ (41,046), ‘White: Gypsy or Irish Traveller, Roma or Other White’ (34,366), ‘Black, Black British, Black Welsh, Caribbean or African’ (29,050), ‘Other ethnic group’ (19,027), ‘Mixed or Multiple ethnic groups’ (9,196) and the smallest group was ‘White: Irish’ (2,545).
In terms of trans people who recorded that they were disabled under the Equality Act, 13,954 trans women were disabled, 13,838 trans men were disabled and 26,734 people were disable whose gender was under the ‘All other gender identities’ category.
There were some clear trends across trans gender identity and age, as shown in the graph below.
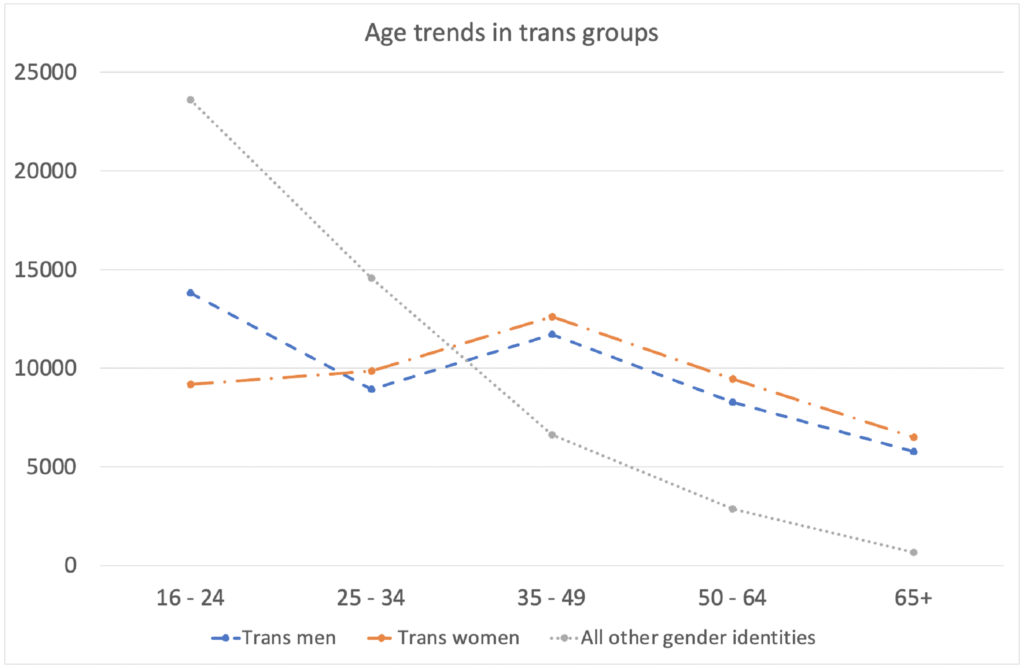
[The line with small dots is ‘All other gender identities’, the line with the regular dashes is ‘Trans men’ and the line with the dashes and dots is ‘Trans women’]

The largest concentration of trans people in an age group was ‘All other gender identities’ which includes non-binary people, and was in the 16-24 range. Data was not shared regarding the gender identity of people aged 15 and under.
There is a clear trend of trans men and trans women following a similar age profile, but with more trans men in the 16-24 age group. There is also a bump in the middle with more binary trans people overall who are in the 35-49 age group. The smallest groups were people who are over 35 and who fit in the ‘All other gender identities’ category.
The wide range of types of data mean there is a lot of work for researchers to do over the coming weeks, months and years, to identify further trends.
It is critical that these data are used to work out how trans and non-binary people can be supported to connect with and thrive in their communities
This article was funded by LGBT+ Futures: Equity Fund is a two-year £786,000 partnership between Consortium and The National Lottery Community Fund, designed to help community-led and grassroot organisations supporting some of the most under-represented and marginalised LGBT+ communities. Read more here.


